Visual Analysis of Trajectories in Multi-Dimensional State Spaces
Today I want to talk about one of my newest published research papers, about visualization of multi-dimensional trajectories. It is electronically available here at the Wiley Online Library (http://onlinelibrary.wiley.com/doi/10.1111/cgf.12352/abstract): Visual Analysis of Trajectories in Multi-Dimensional State Spaces [1].
First off, what is multi-dimensional trajectory? We were investigating the state of complex systems, like automation system or robotics. Each element of such a system, e.g. a robotic motor or a sensor, holds several state variables, like sensed temperature or rotation moment applied by the motor. These variables might even be vectors. But even if they are only scalar values, the system is constituted from several dozens of such elements. Thus, the state of the whole system is always a vector containing the state variables of all components. For the systems we investigated, these vectors are of the size of severs tens or variables. This order or magnitude is referred to by the term multi-dimensional, compared to high-dimensional, which refers to data with several hundred or thousand dimensions. The whole system state can be understood as point in the multi-dimensional state space. Now, our system is not static, but is monitored in real time. Thus the values of the state variables change. Temperatures rise and motors move. This can be interpreted as the point of the system state moving through the state space. This movement path is what we call the trajectory.
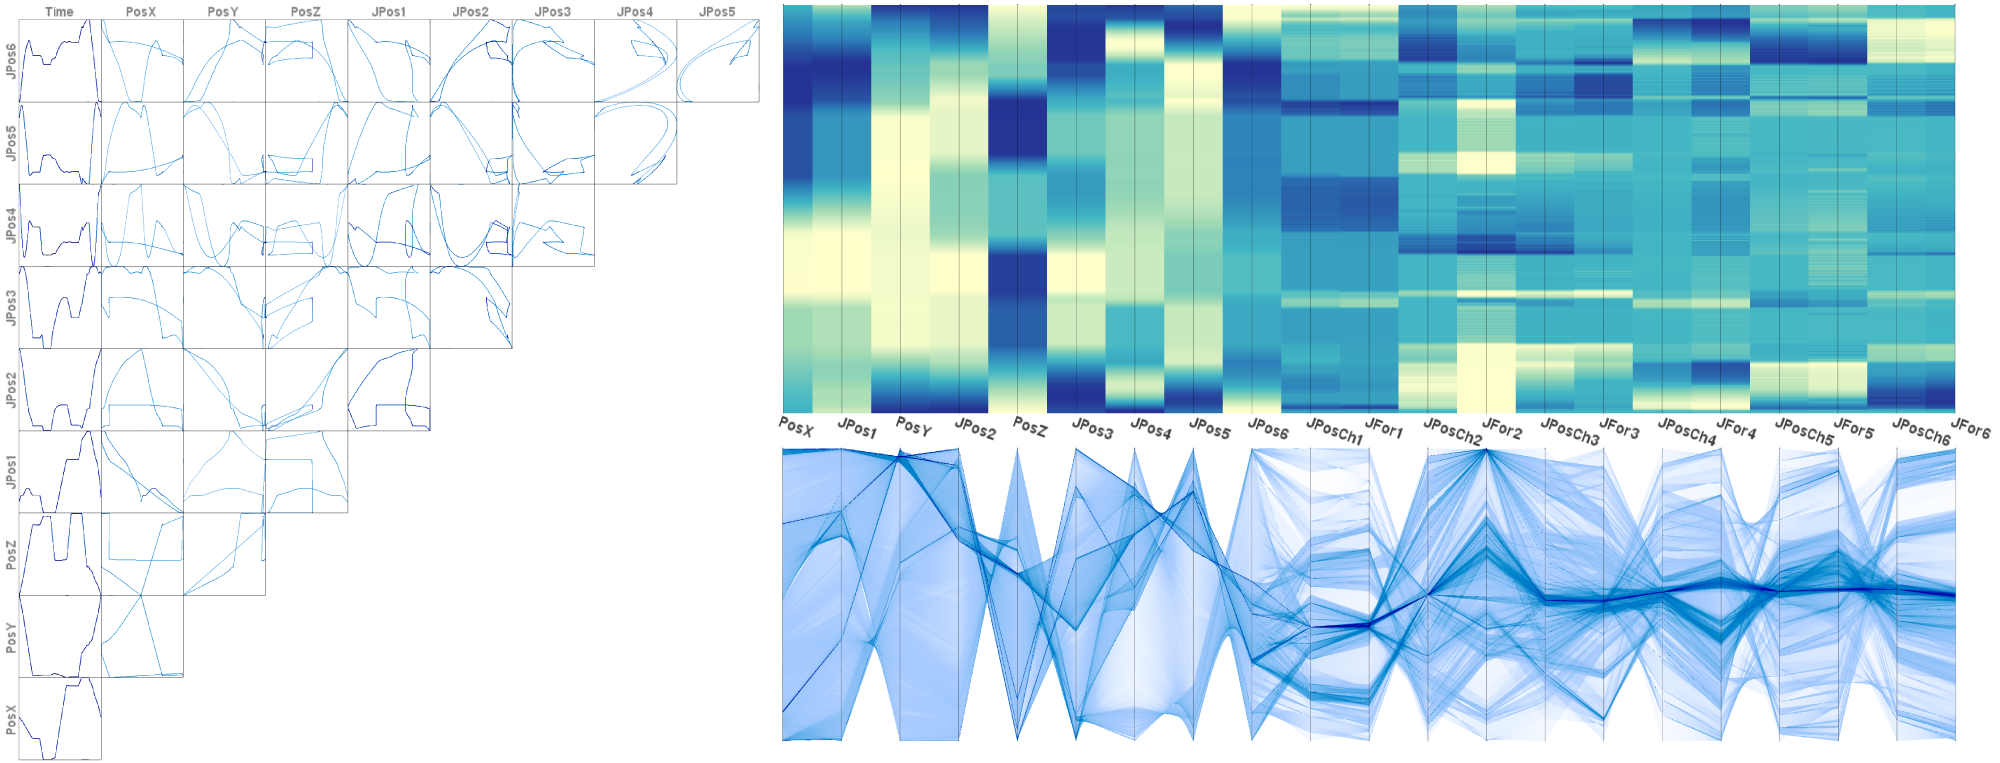
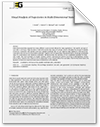
Our approach on visualizing this trajectory was using classical visualization metaphors on multi-dimensional data visualization, namely scatterplot matrices and parallel coordinate plots. We supplemented these plots with additional views, like a temporal heat map. The main aspect of our work was the technique we used to generate these plots. Normally, the sample points of the data will be simply drawn into the plots as points or poly-lines. We, however, took the nature of the data into account, which is the temporal continuity of the discretely sampled signal. We constructed an integration concept for continuous plots in this respect. Our work was based on previous work on continuous scatterplots and parallel coordinate plots, which used spatially continuous interpolation. We adapted this concept to continuous-time interpolation.
[Bibtex]
@article {Grottel2014HDTraj,
  author = {Grottel, Sebastian and Heinrich, Julian and Weiskopf, Daniel and Gumhold, Stefan},
  title = {{Visual Analysis of Trajectories in Multi-Dimensional State Spaces}},
  year = {2014},
  journal = {Computer Graphics Forum},
volume = {33},
number = {6},
pages = {310--321},
  doi = {10.1111/cgf.12352}
}
Leave a Reply