I have written about this before, but here is the official news reblogged from the SFB 716 website.

GPU-based interactive Visualization of Large Particle Data

20151112_vis2015_tutorialAt the end of October, the largest conference on scientific visualization – the IEEE VIS 2015 – took place in Chicago. This is an anual venue for experts from all over the world to present current research and discuss future challenges. With more than 1100 participants, the conference is considered the largest and most important international forum in this domain.

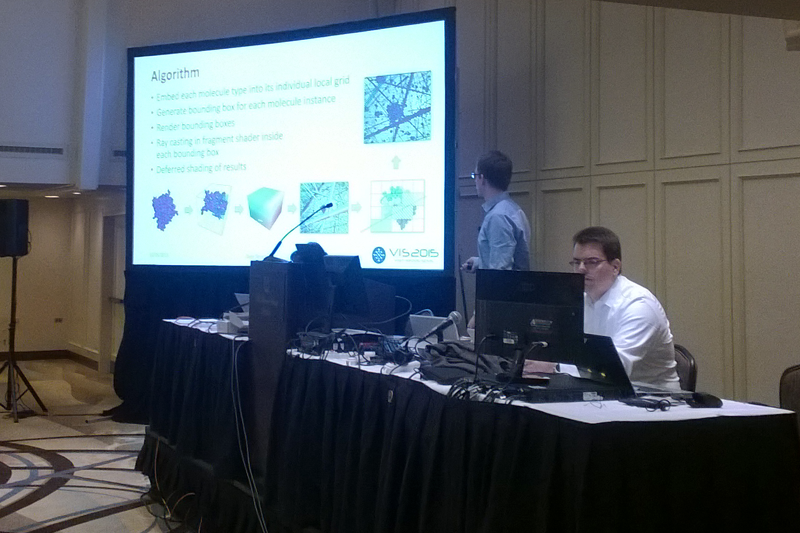
This year, Michael Krone and Guido Reina from the group of Prof. Ertl, together with Sebastian Grottel (TU Dresden) and Martin Falk (Linköping University, Sweden) organized a tutorial on interactive GPU-based Visualization of large particle data. They explained the technical aspects for ensuring high quality and interactivity of particle visualizaton, which are nowadays accepted as state of the art. Part of these techniques have been developed in the SFB716. Additionally, the presentation included details on abstractions required by continuosly growing data sets. Such abstractions were disucssed in the context of biomolecules and material surfaces as well as in the context of whole cell visualization.

The tutorial was very well received with over 50 participants. The course materials distributed there, including slides, source code and example data sets can be downloaded here.

The ESF-funded junior research group VICCI dealt from 2012 until the end of 2014 with the development, control and integration of cyber physical systems (CPS) at the Faculty of Computer Science of the Dresden University of Technology. The scope includes smart home environments and supporting people in the ambient assisted living.

My work package for visualization and visual analysis has within the project investigated three essential aspects and corresponding solutions:

  • visual analysis of complex, multi-dimensional, multimodal, dynamic space-time data,
  • visualization in heterogeneous, mobile and distributed IT infrastructure, and
  • implementation of visualization systems and components.

Today I am writing about the visual analysis of complex space-time data.

teaser

Visual analysis serves as administrative overview of a current CPS, mainly for security reasons, as assistance during development, and the operation of the system. Particularly interesting are out-of-the-ordinary (erroneous) behavior and the formation of emergent system properties. For this a visual exploration with minimal previous assumptions is necessary. For example, certain data, like forces acting upon joints of a robot arm, be visualized more effectively by representations in geometrical context. This assumption however reduced the generality of visualization.

I thus developed a corresponding visualization of data collected by the CPS using coordinated views of continuous-time scatter plots, continuous-time parallel coordinate plots and temporal heatmaps. This application is capable of interactive real-time representation of generic multi-dimensional data and offers the means for a visual analysis. The developed system was published in the journal Computer Graphics Forum, the leading European Journal on Visualization. In the context of the evaluation, live data from our laboratory CPS war visualized, presented and discussed with a broad audience.

  • [DOI] S. Grottel, J. Heinrich, D. Weiskopf, and S. Gumhold, “Visual Analysis of Trajectories in Multi-Dimensional State Spaces,” Computer Graphics Forum, vol. 33, iss. 6, pp. 310-321, 2014.
    [Bibtex]
    @article {Grottel2014HDTraj,
      author = {Grottel, Sebastian and Heinrich, Julian and Weiskopf, Daniel and Gumhold, Stefan},
      title = {{Visual Analysis of Trajectories in Multi-Dimensional State Spaces}},
      year = {2014},
      journal = {Computer Graphics Forum},
    volume = {33},
    number = {6},
    pages = {310--321},
      doi = {10.1111/cgf.12352}
    }

DOI: 10.1111/cgf.12352

This visualization was implemented as a plugin for the MegaMol visualization system. The source code can be downloaded freely and can be used according to the enclosed License:

hdtraj.mmplugin.ziphdtraj.mmplugin.zip Multi-Dimensional Trajectory Visualization MegaMol Plugin
[99.7 KB; MD5: 0a6eaf465318b0f256ecfdf8a8b4ad50; More Info]

To compile the MegaMol system and the plugin, use the appropriate Instructions on the MegaMol website.

Last week was full of work. Somehow, I write something like this every week. Well…

Together with two colleagues I worked on a submission for a conference last week. A nice paper about a visualization technology. Of course, I cannot say more about it as long as it is not accepted for publication yet. We will see. We did a good job and I am confident. Well, I was confident with most papers that got rejected too. Whatever.

Additionally, there was good news last week. The paper of another colleague of mine, with which I was involved, was accepted for publication at the Multimedia Modelling 2015:

  • [DOI] M. Spehr, S. Grottel, and S. Gumhold, “Wifbs: A Web-based Image Feature Benchmark System,” in MultiMedia Modeling – 21th Anniversary International Conference, MMM 2015, Sydney, Australia, January 5-7, 2015, Proceedings, 2015, pp. 159-170.
    [Bibtex]
    @inproceedings{spehr2015mmm,
      author    = {Marcel Spehr and
                   Sebastian Grottel and
                   Stefan Gumhold},
      title     = {Wifbs: A Web-based Image Feature Benchmark System},
      booktitle = {MultiMedia Modeling - 21th Anniversary International Conference, {MMM} 2015, Sydney, Australia, January 5-7, 2015, Proceedings},
      editors   = {Xiangjian He, Suhuai Luo et al.},
      year      = {2015},
      pages     = {159--170},
      doi       = {10.1007/978-3-319-04114-8_2},
    }

I don’t want to take credit for other’s achievements. The idea, the implementation, the system and the publication, all of that was mostly the work of my colleague Marcel Spher. Great work. All I did was helping out with some details, pointing in some directions and helping with writing the paper itself.

I like system papers. It is work beyond simple software used in research. These system, the one presented here and my MegaMol, have the potential to stay useful for a long time.

Today, I am only writing a short note on MegaMol.

We have done it! We published the MegaMol system as systems paper:

  • [DOI] S. Grottel, M. Krone, C. Müller, G. Reina, and T. Ertl, “MegaMol — A Prototyping Framework for Particle-based Visualization,” Visualization and Computer Graphics, IEEE Transactions on, vol. 21, iss. 2, pp. 201-214, 2015.
    [Bibtex]
    @article{grottel2014megamol,
        author={Grottel, S. and Krone, M. and M\"{u}ller, C. and Reina, G. and Ertl, T.},
        journal={Visualization and Computer Graphics, IEEE Transactions on},
        title={MegaMol -- A Prototyping Framework for Particle-based Visualization},
        year={2015},
        month={2},
        volume={21},
        number={2},
        pages={201--214},
        keywords={Data models;Data visualization;Graphics processing units;Libraries;Rendering (computer graphics);Visualization},
        doi={10.1109/TVCG.2014.2350479},
        ISSN={1077-2626}
    }

Doi: 10.1109/TVCG.2014.2350479

All the hard work really paid off. MegaMol has now been published in the IEEE Journal “Transactions on Visualization and Computer Graphics”, in short TVCG. That is the top journal of the visualization community. I have to admit, I am pretty proud.

And I am curious what will come next. I would like to continue working with MegaMol, and to help to evolve the software even further. But, of course, this depends on my future employment. MegaMol has such a potential. *sigh*

Today I want to talk about one of my newest published research papers, about visualization of multi-dimensional trajectories. It is electronically available here at the Wiley Online Library (http://onlinelibrary.wiley.com/doi/10.1111/cgf.12352/abstract): Visual Analysis of Trajectories in Multi-Dimensional State Spaces [1].

First off, what is multi-dimensional trajectory? We were investigating the state of complex systems, like automation system or robotics. Each element of such a system, e.g. a robotic motor or a sensor, holds several state variables, like sensed temperature or rotation moment applied by the motor. These variables might even be vectors. But even if they are only scalar values, the system is constituted from several dozens of such elements. Thus, the state of the whole system is always a vector containing the state variables of all components. For the systems we investigated, these vectors are of the size of severs tens or variables. This order or magnitude is referred to by the term multi-dimensional, compared to high-dimensional, which refers to data with several hundred or thousand dimensions. The whole system state can be understood as point in the multi-dimensional state space. Now, our system is not static, but is monitored in real time. Thus the values of the state variables change. Temperatures rise and motors move. This can be interpreted as the point of the system state moving through the state space. This movement path is what we call the trajectory.

md_trajectory_teaser

Our approach on visualizing this trajectory was using classical visualization metaphors on multi-dimensional data visualization, namely scatterplot matrices and parallel coordinate plots. We supplemented these plots with additional views, like a temporal heat map. The main aspect of our work was the technique we used to generate these plots. Normally, the sample points of the data will be simply drawn into the plots as points or poly-lines. We, however, took the nature of the data into account, which is the temporal continuity of the discretely sampled signal. We constructed an integration concept for continuous plots in this respect. Our work was based on previous work on continuous scatterplots and parallel coordinate plots, which used spatially continuous interpolation. We adapted this concept to continuous-time interpolation.

 md_trajectory_compare

[1] [doi] S. Grottel, J. Heinrich, D. Weiskopf, and S. Gumhold, “Visual Analysis of Trajectories in Multi-Dimensional State Spaces,” Computer Graphics Forum, vol. 33, iss. 6, pp. 310-321, 2014.
[Bibtex]
@article {Grottel2014HDTraj,
  author = {Grottel, Sebastian and Heinrich, Julian and Weiskopf, Daniel and Gumhold, Stefan},
  title = {{Visual Analysis of Trajectories in Multi-Dimensional State Spaces}},
  year = {2014},
  journal = {Computer Graphics Forum},
volume = {33},
number = {6},
pages = {310--321},
  doi = {10.1111/cgf.12352}
}

In the years from 2007 to 2012 I worked at the Visualization Research Center of the University of Stuttgart, respectively at the Institute for Visualization and Interactive Systems. The core topic of my work was research and development of visualizations for data sets from molecular dynamics simulations. My work was financed by the Collaborative Research Center (SFB) 716 of the German Research Foundation (DFG). One goal was to be able to handle ever larger data sets in interactive visualization. A second goal was to support efficient visual analysis, utilizing meaningful representations derived from the original data.

Finally, in 2007 I presented my first work at the IEEE VIS Conference in Sacramento, a paper with the title “Visual Verification and Analysis of Cluster Detection for Molecular Dynamics” [1]. This work focuses on algorithms for detecting of clusters of molecules, predecessors of liquid droplets in vapor. Each of these detection algorithms has its strong and weak points. Therefore, the visual analysis and comparison of the results are very important. Especially the temporal stability of the detected clusters and their interaction with each other are crucial factors.

Thus we (my colleagues and I) defined “flow groups” to identify interesting areas within the data sets. A “flow group” is a group of molecules, moving from one point in time from one molecule cluster to a second molecule cluster at a second point in time, this this group comprises all molecules switch between two clusters together. This definition enables us to visually judge the stability of an algorithm and even to compare two different algorithms. This publication was the first corner stone for my dissertation thesis: “Point-based Visualization of Molecular Dynamics Data Sets”.

[1] [doi] S. Grottel, G. Reina, J. Vrabec, and T. Ertl, “Visual Verification and Analysis of Cluster Detection for Molecular Dynamics,” Visualization and Computer Graphics, IEEE Transactions on, vol. 13, iss. 6, pp. 1624-1631, 2007.
[Bibtex]
@article{Grottel2007nucleation,
  author = {Grottel, Sebastian and Reina, Guido and Vrabec, Jadran and Ertl, Thomas},
  journal={Visualization and Computer Graphics, IEEE Transactions on}, 
  number = 6,
  pages = {1624--1631},
  title = {{Visual Verification and Analysis of Cluster Detection for Molecular Dynamics}},
  volume = 13,
  year = 2007,
  doi={10.1109/TVCG.2007.70614},
}