The ESF-funded junior research group VICCI dealt from 2012 until the end of 2014 with the development, control and integration of cyber physical systems (CPS) at the Faculty of Computer Science of the Dresden University of Technology. The scope includes smart home environments and supporting people in the ambient assisted living.

Today, I am writing about Visualization in heterogeneous and distributed infrastructure. Well, this sounds more advanced than it is. Is simply is about remote visualization.

A first prototype for compressed video transfer was successfully integrated in a collaboration project with the HZDR Dresden by a co-advised student project. This work was presented on the international conferences SuperComputing 2013 (Denver) and 2014 (New Orleans). Both presentations focused on the PIConGPU research project by the HZDR, was an ACM Gordon Bell Finalist at the SC2013. This shows the clear applicability of our approach.

The video transfer, being the crucial part of the whole approach, was extended by multiple different compression techniques. In addition and worth a special mention is the bachelor thesis of Christoph Träger, which aimed at latency masking via image interpolation and extrapolation at the displaying thin client.

ba_traeger_idee

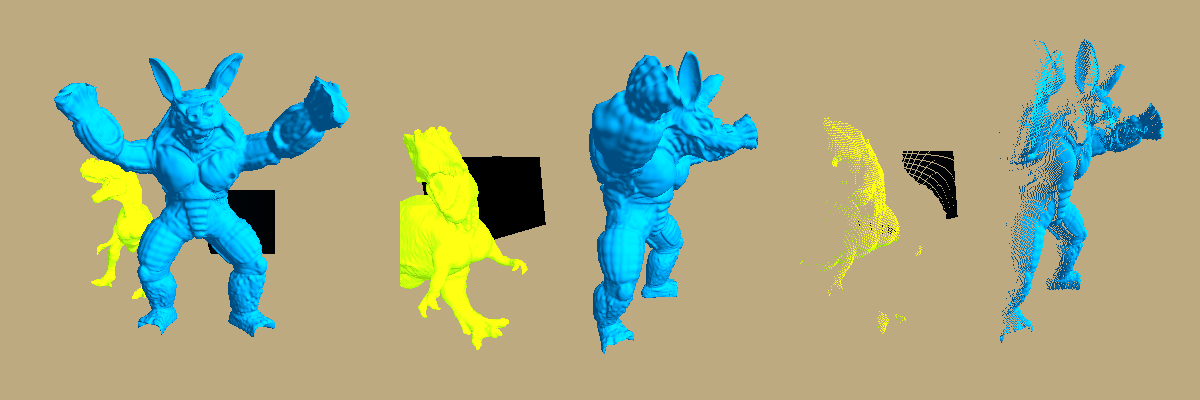
The core idea is latency masking via image interpolation on the display device. Based on the original image (left) the target image (center) is approximated. Re-projection of the image data allows for this approximation (right).

The prototypical software component for the video transfer is called RIV. The current state of the project can be downloaded from the VICCI website.

The implementation of the image interpolation for latency masking can be downloaded from the website of the bachelor thesis of Christoph Träger. Important: all rights on that source code remain with Christoph Träger! The source code presented there may only be used for teaching and research. Any further use requires the consent of the original author. The TU Dresden has the right for additional use of the source code.


The ESF-funded junior research group VICCI dealt from 2012 until the end of 2014 with the development, control and integration of cyber physical systems (CPS) at the Faculty of Computer Science of the Dresden University of Technology. The scope includes smart home environments and supporting people in the ambient assisted living.

My work package for visualization and visual analysis has within the project investigated three essential aspects and corresponding solutions:

  • visual analysis of complex, multi-dimensional, multimodal, dynamic space-time data,
  • visualization in heterogeneous, mobile and distributed IT infrastructure, and
  • implementation of visualization systems and components.

Today I am writing about the visual analysis of complex space-time data.

teaser

Visual analysis serves as administrative overview of a current CPS, mainly for security reasons, as assistance during development, and the operation of the system. Particularly interesting are out-of-the-ordinary (erroneous) behavior and the formation of emergent system properties. For this a visual exploration with minimal previous assumptions is necessary. For example, certain data, like forces acting upon joints of a robot arm, be visualized more effectively by representations in geometrical context. This assumption however reduced the generality of visualization.

I thus developed a corresponding visualization of data collected by the CPS using coordinated views of continuous-time scatter plots, continuous-time parallel coordinate plots and temporal heatmaps. This application is capable of interactive real-time representation of generic multi-dimensional data and offers the means for a visual analysis. The developed system was published in the journal Computer Graphics Forum, the leading European Journal on Visualization. In the context of the evaluation, live data from our laboratory CPS war visualized, presented and discussed with a broad audience.

  • [DOI] S. Grottel, J. Heinrich, D. Weiskopf, and S. Gumhold, “Visual Analysis of Trajectories in Multi-Dimensional State Spaces,” Computer Graphics Forum, vol. 33, iss. 6, pp. 310-321, 2014.
    [Bibtex]
    @article {Grottel2014HDTraj,
      author = {Grottel, Sebastian and Heinrich, Julian and Weiskopf, Daniel and Gumhold, Stefan},
      title = {{Visual Analysis of Trajectories in Multi-Dimensional State Spaces}},
      year = {2014},
      journal = {Computer Graphics Forum},
    volume = {33},
    number = {6},
    pages = {310--321},
      doi = {10.1111/cgf.12352}
    }

DOI: 10.1111/cgf.12352

This visualization was implemented as a plugin for the MegaMol visualization system. The source code can be downloaded freely and can be used according to the enclosed License:

hdtraj.mmplugin.ziphdtraj.mmplugin.zip Multi-Dimensional Trajectory Visualization MegaMol Plugin
[99.7 KB; MD5: 0a6eaf465318b0f256ecfdf8a8b4ad50; More Info]

To compile the MegaMol system and the plugin, use the appropriate Instructions on the MegaMol website.

In the years from 2007 to 2012 I worked at the Visualization Research Center of the University of Stuttgart, respectively at the Institute for Visualization and Interactive Systems. The core topic of my work was research and development of visualizations for data sets from molecular dynamics simulations. My work was financed by the Collaborative Research Center (SFB) 716 of the German Research Foundation (DFG). One goal was to be able to handle ever larger data sets in interactive visualization. A second goal was to support efficient visual analysis, utilizing meaningful representations derived from the original data.

Finally, in 2007 I presented my first work at the IEEE VIS Conference in Sacramento, a paper with the title “Visual Verification and Analysis of Cluster Detection for Molecular Dynamics” [1]. This work focuses on algorithms for detecting of clusters of molecules, predecessors of liquid droplets in vapor. Each of these detection algorithms has its strong and weak points. Therefore, the visual analysis and comparison of the results are very important. Especially the temporal stability of the detected clusters and their interaction with each other are crucial factors.

Thus we (my colleagues and I) defined “flow groups” to identify interesting areas within the data sets. A “flow group” is a group of molecules, moving from one point in time from one molecule cluster to a second molecule cluster at a second point in time, this this group comprises all molecules switch between two clusters together. This definition enables us to visually judge the stability of an algorithm and even to compare two different algorithms. This publication was the first corner stone for my dissertation thesis: “Point-based Visualization of Molecular Dynamics Data Sets”.

[1] [doi] S. Grottel, G. Reina, J. Vrabec, and T. Ertl, “Visual Verification and Analysis of Cluster Detection for Molecular Dynamics,” Visualization and Computer Graphics, IEEE Transactions on, vol. 13, iss. 6, pp. 1624-1631, 2007.
[Bibtex]
@article{Grottel2007nucleation,
  author = {Grottel, Sebastian and Reina, Guido and Vrabec, Jadran and Ertl, Thomas},
  journal={Visualization and Computer Graphics, IEEE Transactions on}, 
  number = 6,
  pages = {1624--1631},
  title = {{Visual Verification and Analysis of Cluster Detection for Molecular Dynamics}},
  volume = 13,
  year = 2007,
  doi={10.1109/TVCG.2007.70614},
}